http://decisionmoose.com/Moosignal.html
一年進出轉換次數少 (個位數), 年化績效還不錯,推薦給大家參考~
信號完全免費,網站很有誠意完全沒有亂七八糟的廣告,只是一直始終如一的發佈信號。
本周轉換到 GLD
http://decisionmoose.com/Moosignal.html
一年進出轉換次數少 (個位數), 年化績效還不錯,推薦給大家參考~
信號完全免費,網站很有誠意完全沒有亂七八糟的廣告,只是一直始終如一的發佈信號。
本周轉換到 GLD

美國四家銀行多單增持至 15634 口, 以趨勢來看是從去年 12月初的淨空單13萬口持續作多第六個月
以下圖 GLD 黃金ETF 的同期週線圖來看, 均線仍保持的向上的趨勢

同場加映河流圖 , 可以看出大方向一直沒有改變, 上個月我提了一個簡單的想法:
“從河流圖來看, 黃金價格仍然穩定上升區間中, 可試以下策略
在靠近 EMA(20) (圖中綠線) 時買進, 以 -ENV(20,5.0) 為停損點, +ENV(20,10.0) 為停利點
下個月再來檢討看看成效如何”

看來已經接近停利點 (1235)
補充追蹤

在本周的 “震憾教育” 下, 股價雖重挫近 10%, 然僅止是回到河流中央, 待河流轉向再說
二月即將結束, 本周走勢對於空頭來講可以稍稍鬆一口氣, 在次姑且以 GLD 這隻黃金 ETF 來稍稍作個回顧。 GLD的 月線 ( 20 日均線)自十二月中上穿過 季線 (60日) 後, 年線也正式翻揚呈現短中長期均線同步向上的格局。儘管之後 上下震盪一個月左右於一月中甚至跌破三條均線之下, 但隨即翻揚甚至突破盤整的高點 87.10。事後來看, 三均線翻揚價格創新高, 本就是後勢看好宜順勢作多。而二月以來的走勢在漲到 98.99 逼近前波高點 100.44 只一步之遙, 出現獲利回吐賣壓, 金價再度回測月線。以多頭行情來看, 回測月線還算健康。

現在來看看週線, 現在的價位看起來確實有過高之虞, 成交量放大也是正常,如果要再創新高的話, 量能應該還會再大。

綜合以上結果, 我估計黃金在未來一個月內會輕鬆越過 100.44, 創新高, 三月出爐的二月期貨統計, 三大美國銀行黃金空單會續增至 15 萬張。
我大概是吃了熊心豹子膽敢這樣預測....
CFTC 更新了資料, 於是我就把它們加總, 就這樣囉
看起來 11月21 日的空頭回補大屠殺, 嘎到的都是 non-US 的銀行, US 的三家銀行的空單反而增加了兩萬多口, 有意思, 有意思....

選擇權的部份可以看出來的是未平倉數量大減, 大概就獲利出場 (另一方停損出場) 就這樣,硬要說有什麼改變的話, 大概就是 non-US 的淨空單 (long calls+ sell puts - long puts - sell calls) 十二個月來首度變負的 (-2484), US 的則由 (-21298) 變成 (-11764)


再來補兩張金價跟 GLD ETF 的周線圖

再來是我 "希望" 它們跌的黃金類股指數
日前在某討論區看到一篇介紹反向及槓桿型 ETF 的文章, 內容堪稱深入淺出, 經作者同意後翻譯登出, 並附上原文及連結於後.
![]()
Suppose you believe that the market is going to go down, what would you do? The normal answer is sell what you have and get out. However, what if you have nothing to sell? Until a couple of years ago, the answer would have been "Stay on the sidelines" for simple investors. The sophisticated investors always had plenty of avenues - shorting the stock, buying puts, selling naked calls, etc.
如果你相信市場即將要向下走, 你會怎麼作? 一般普通人的答案是把你手中有的全部賣掉, 然後離開市場. 然而, 如果你手上根本就沒東西可以賣呢? 相對於其他精明的投資人總是有各種方法, 如做空股票,買"賣權", 賣 "買權" 等... 直到幾年前, 普通的投資人只能當個局外人.
However, the gap was narrowed with the arrival of Inverse ETFs that allow even novice investors to short the market in a less risky way (you cannot lose more than what you put in the ETF, while in shorts your loss is theoretically unlimited and this can be psychologically unsettling for some). However, the power and pitfalls of these instruments are poorly understood by many, particularly by the long term investors. The power is obvious - you can go 1/X or 2/X of the market pretty easily, leaving all the pesky details of achieving them to the ETF managers. Here are the pitfalls.
然而, 這個差距在反向 ETF 出現之後被縮小了, 就算是剛入門的投資者也可以用一種較低風險的方式來作空. (最多就損失你投入 ETF 的錢, 而普通作空的方式理論上的損失是無限制的, 後者在心理上會使某些人感到不安). 不過呢, 這些工具的能力跟陷阱並不為大多數人所清楚了解, 特別是對於長期投資者. 他們的能力是很明顯的, 你可以很輕易的往市場的反向 (1倍或是 2倍) 走, 並把那些惱人的細節都留給 ETF 的經理人. 接下來的是陷阱!
1. Inverse and Leveraged ETFs lose money over the long term
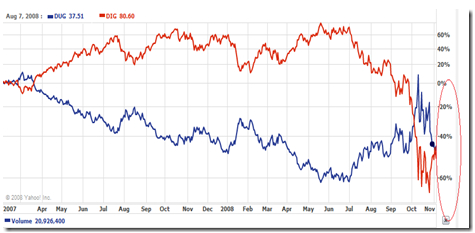
Here is the chart from Yahoo Finance of DUG (Double inverse of petroleum companies) and DIG (Goes 2X in the direction of petroleum companies). Basically they are the yin and yang of Oil industry. Regardless of what happens in the market surely one of them must win, right? But, look deeply at the cart - both of these funds lost 45% in the last 20 months.
1. 長期來看, 反向或是槓桿 ETF 都會虧損
底下是從 Yahoo Finance 所取的 DUG (石油公司的雙倍反向ETF) 與 DIG (雙倍作多石油公司) 的圖. 基本上他們是石油產業的 陰 與 陽. 無論市場發生什麼事, 總會有一方獲勝, 不是嗎? 但是, 仔細看一下這個圖, 這兩檔基金都分別賠了 45% 在最近的 20 個月之內.
所以, 就算你能夠預測市場正確的方向, 你還是會在一年半之內輸掉一半的錢...
So, even if you had predicted the correct direction, you would have lost half your money in just 1.5 years.
2. Inverse ETFs can track the underlying for only one time period
Mathematically, leveraged and inverse ETFs can track their underlying index exactly for one time period only. If they track their index accurately for hourly, then it can't track for daily, weekly, monthly and so on. This is due to the way compounding works. Let us say your underlying went 1% down everyday for 1 month. The underlying will go down 26% [(1-0.01)^30], while your inverse would have gone up 35% [(1+0.01)^30]. Most inverse funds plan to track daily, so for other time periods you will see an error.
2. 反向 ETFs 只能在一段時間內緊貼相關指數
從數學上來說, 槓桿跟反向 ETF 只能夠在一段時間內完全的追蹤其相關指數. 如果他們準確的追蹤指數每個小時的表現, 則不能適用於每天, 每週, 每個月的指數表現. 這是因為複合增長的關係. 舉例來說, 如果你的相關指數每天跌 1% 跌一個月, 則一個月後總共跌了 26% [(1-0.01)^30], 同時你的反向基金則會上漲 35% [(1+0.01)^30]. 大部份的反向基金都是追蹤每天的表現, 所以在其他的時間區間下, 誤差就會產生.
3. Tracking error increases with time
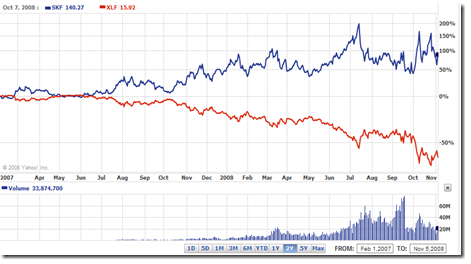
Here is the comparison chart between XLF (Financial Sector Index) and its double Inverse SKF. SKF is supposed to go 2X in the opposite direction of XLF, and though it was good in maintaining the direction, it was not very good in exact tracking. XLF fell 62% in the period from February 2007, while SKF has gone up only 90%, instead of 124% as would have been expected.
3. 追蹤誤差隨著時間而增加
這裡有一張比較 XLF (金融指數) 跟它的雙倍反向 SKF 的比較圖. SKF 應該是往 XLF 的兩倍反向走, 儘管這次方向是對了, 但是卻沒能完全的追蹤. XLF 從 2007 年二月開始跌了 62% , 同時 SKF 只有上漲 90%, 離預期的 124% 還有一段距離.
4. Degenerative decay and relationship to volatility
Leveraged ETFs' efficiency goes down with volatility. The problem is even more so with inverse ETFs. Let us say the Dow went from 10K to 8K and back to 10K. An inverse ETF tracking accurately will go up from 100 to 120 (20% gain to equal 20% loss in Dow) and then from 120 to 90 (25% loss because Dow gained 25%). So, from period t1 to t2, the Dow stayed the same, while its inverse ETF fell by 10% from 100 to 90. Repeat the same process x number of times, and you will find the inverse ETFs totally wiped out of the value, while underlying has not moved much. If the Dow goes up to 10000 from 9900 and back to 10000, the inverse would be reasonably accurate. However, we are at a historically high volatility - the highest in the last 20 years. Here is the movement of volatility Index [VIX] over the last 18 years.

4. 變質的衰退與跟市場波動的關連
槓桿ETF 的效率會隨著市場波動程度變大而變差. 反向的 ETF 問題甚至更加嚴重. 舉例來說, 當道瓊指數從 一萬點跌到八千點, 然後再漲回一萬點. 反向的 ETF 精準的追蹤指數的話會從 100 漲到 120 (漲 20%, 道瓊跌 20%) 然後再從 120 跌到 90 ( 跌 25%, 因為道瓊漲了 25%). 因此我們可以發現, 當時間從 t1 到 t2 , 道瓊指數不變, 然而反向 ETF 卻跌了 10% 從 100 跌到 90. 當同樣的程序不斷重複 x 次, 你會發現反向 ETF 的價值全部消失而相關指數則沒有改變多少. 一般來說如果道瓊指數從 10000跌到 9900 再漲回 10000, 基本上反向ETF 大致還是精準的. 但是我們現在處在歷史紀錄的高波動市場中, 是過去 20 年以來最高的. 上面是過去 18 年以來的波動指數[VIX] 走勢
5. Constant Leverage Trap
Constant Leverage Trap is a well know problem in financial modeling and affects the performance of inverse ETFs. Here is a simple scenario explained by Tyates in a financial forum:
5. 持續的槓桿陷阱
持續的槓桿陷阱是金融模型上一個廣為人知的問題, 它也影響反向 ETF 的表現. 底下是 Tyates 在一個金融論壇上提出的一個簡單劇本.
Proshares has $1m of investor money and borrows $1m of additional money to invest $2m in the S&P 500 index. After six months, the index appreciates 10%, and then the fund has $2.2m in assets and $1.2m of equity. (Let's ignore interest on debt for now).
Proshares (著名的這類ETF 的發行公司) 有 一百萬 投資人的錢, 然後他再去借 一百萬總共投資在 S&P 500 指數. 六個月後, 指數增值了 10%, 則此時基金有 兩百二十萬的資產, 淨值則有一百二十萬. (暫且先省略負債的利息)
The problem is that the fund now has a lower debt to equity ratio than advertised. It is supposed to be a 2x fund, but now only has $1m of debt paired with its $1.2m of equity, making it a 1.67x fund. In order to get back to its target leverage it has to borrow $200,000 and invest in the index. Now the fund has $2.4m in assets and $1.2m in debt. Six more months go by, and the index falls 10%. The fund now has $2.16m in assets and $1.2m in debt, leaving the investors with $960k in equity. This 4% loss surprises investors who thought that the index was down 1% for the year (+10% and -10% = -1%).
問題是, 現在基金的負債淨值比例已經低於它所公佈的. 它應該是一個兩倍的基金, 現在它有一百萬的債配上一百二十萬的淨值, 使得它成為一個 1.67 倍的基金. 為了要能夠變回原先的兩倍槓桿, 它必須再借 20 萬的錢再投入到該指數中. 現在基金 有 兩百四十萬的資產及一百二十萬的負債. 又過了六個月, 該指數跌了 10%. 這時基金現有兩百一十六萬的資產, 還有一百二十萬的負債, 淨值是九十六萬. 投資人可能會被 4% 的虧損嚇到, 明明指數一整年不過跌 1% (漲10% 再跌 10% = 跌 1%)
But what happens next is even worse. Because the leverage ratio is out of balance again - total assets are 2.25x the equity, not 2x - the fund has to sell its shares in order to reduce its leverage back down to 2x. It sells $240k worth of shares, and applies all of this cash to reducing the debt to $960k. The fund is now smaller than when it started. Yes, you read that correctly, to maintain constant leverage, this index fund is constantly buying and selling, incurring short-term gains, and doing the worst possible market timing - buying more on margin when prices are high and selling when they're lower.
6. Regulatory Actions:
When the SEC comes up with a short ban as it did in September, it can substantially screw up the market. For a couple of weeks SKF was affected due to its inability to find appropriate counterparties for its trade. Typically, governments tend to go more after bears than bulls in a mistaken fear that bears are causing the problems instead of being the messenger of problem information. Thus regulatory actions can be more unfavorable to bearish strategies than bullish strategies.
http://biz.yahoo.com/ms/
6. 調控行為
當 SEC 在九月份時提出要禁止放空時, 這項措施大大的搞砸了這個市場. 有好幾個星期 SKF 的表現因為不能找到適當的交易對手而受到很大的影響. 一般說來, 政府傾向追殺熊更甚於牛, 基於一種誤解的恐懼, 怕熊會製造麻煩而不把牠當成是問題資訊的使差. 因此, 調節行為對於熊市策略來講更不被喜好.
7. Counterparty risk
Inverse ETFs achieve their strategies through swaps and futures contracts with various counterparties. There are troubles when the counterparties don't honor their contract. When these parties fail, then the ETF could lose money.
Here is some good information on this, written by Paul Amery.
7. 交易對手風險
反向ETF 透過掉期交易及與各路人馬的期貨合約來達到它的策略目的. 所以當交易對手不履行合約的話, 就會有麻煩了.
8. Other factors to consider
8. 其它要考慮的因素
你能受得了市場波動嗎? 雙倍反向跟槓桿 ETF 從定義上來看傾向更劇烈的波動, 特別是像最近的情況. 你可能會看到你的投資組合上下 50% 甚至 75% . 你如果會因此而睡不好的話, 最好別玩. 另外這類的 ETF 的管理費也遠較其它單純的指數 ETF 來得高, 甚至可達 5倍之多.
Summary:
Inverse and leveraged ETFs are great tools that democratized bear strategies. However it should not be used for anything other than short term trading purposes. And when you use it, understand its risks and don't be surprised when you find the results are not as promised.
總結
反向跟槓桿 ETF 是很棒的工具使得熊市策略更加大眾化. 然而它不應該用來做除了 "短期交易" 以外的用途. 如果你用了它, 請了解它的風險, 並且當你發現結果不像它所承諾時, 不要太過驚訝嘿~


黃金類股大漲的隔日出現了這麼一篇 "新聞" (我一向把這種新聞當作是莊家故意放出來的消息):
摘錄其中兩段
"Robert認為黃金與AMEX金蟲指數的比值若來到2.5之上,代表著黃金類股相對於黃金被市場嚴重低估,而現今此比值為4.8215,意味著黃金類股較佳的買點相對買點。"
"黃金漲勢受股市勁揚而受壓抑,680~700美元仍是進場的買點,目前金價約在735元附近,根據歷史經驗,Fed降息循環與維持低利率有利金價支撐。"
我們就來看看他們所用的黃金與 AMEX Gold Bugs ($HUI) 的 比較圖

首先 Robert 所說的 4.8 高點,應該是在 十月 27 日的事了,看線圖也是非常完美的底部進場點。只是當這則分析報導出來已經是一個星期之後的事了。而此時 HUI 也剛好巧妙的反彈至月均線左右,這個時候通常就是最多空不明的階段。看多者會期待看到指數站穩月線後向上攻堅;而看空者則會覺得指數上攻乏力,盤久必跌,下看前波低點。比較保守的想法就是觀望,如果它突破了某個壓力區就作多,反之,跌破支撐就作空。
基於看報紙操作多半會虧損的這個前提,我會傾向這則新聞是要讓散戶接棒在山頂吹風的出貨用新聞。在這個想法之下我們再來檢視我一開始引用的那兩段文字:
"Robert認為黃金與AMEX金蟲指數的比值若來到2.5之上,代表著黃金類股相對於黃金被市場嚴重低估,而現今此比值為4.8215,意味著黃金類股較佳的買點相對買點。"
"黃金漲勢受股市勁揚而受壓抑,680~700美元仍是進場的買點,目前金價約在735元附近,根據歷史經驗,Fed降息循環與維持低利率有利金價支撐。"
有沒有發現這兩段立論都是以 "黃金價格下檔有撐" 為大前提? 所以如果比值會持續往下探 (今天 3.5) 比如說回到 2.5,那未來會有兩種可能: 1. 黃金漲,金蟲漲更多;2.黃金跌,金蟲漲或是小跌。
看起來買進黃金類股真是穩當。
不過如果換一個角度來看,如果金蟲漲,黃金小漲或是跌;金蟲跌的話,黃金只能大跌了。
我的想法基本上就是看空黃金價格,金蟲的話就跟隨大盤指數浮浮沉沉 (歐巴馬當選隔天道瓊用大跌 5% 來 "慶祝",同時失守月線,看來空頭還沒走完)。 小心黃金!

| Date | Price | Change | Volume | Buyer | Seller |
| 2008/10/14 14:46 | 10.79 | 0.03 | 2,300 | 80 National Bank | 93 Toll Cross |
| 2008/10/14 14:43 | 10.79 | 0.03 | 200 | 9 BMO Nesbitt | 93 Toll Cross |
| 2008/10/14 14:19 | 10.59 | -0.17 | 2,500 | 124 Questrade | 93 Toll Cross |
| 2008/10/14 14:11 | 10.4 | -0.36 | 2,500 | 80 National Bank | 93 Toll Cross |
| 2008/10/14 14:10 | 10.31 | -0.45 | 2,500 | 80 National Bank | 93 Toll Cross |
| 2008/10/14 14:07 | 10.26 | -0.5 | 700 | 79 CIBC | 93 Toll Cross |
| 2008/10/14 14:07 | 10.26 | -0.5 | 2,000 | 79 CIBC | 93 Toll Cross |
| 2008/10/14 14:07 | 10.26 | -0.5 | 300 | 80 National Bank | 93 Toll Cross |
| 2008/10/14 14:05 | 10.16 | -0.6 | 900 | 80 National Bank | 93 Toll Cross |
| 2008/10/14 14:00 | 10.16 | -0.6 | 2,100 | 88 E-TRADE | 93 Toll Cross |
| 2008/10/14 13:56 | 10.16 | -0.6 | 1,700 | 80 National Bank | 93 Toll Cross |
| 2008/10/14 13:56 | 10.16 | -0.6 | 300 | 80 National Bank | 93 Toll Cross |
| 2008/10/14 13:56 | 10.16 | -0.6 | 2,000 | 88 E-TRADE | 93 Toll Cross |
| 2008/10/14 12:31 | 9.6 | -1.16 | 700 | 9 BMO Nesbitt | 93 Toll Cross |
| 2008/10/14 12:31 | 9.61 | -1.15 | 7,000 | 80 National Bank | 93 Toll Cross |
| 2008/10/14 12:31 | 9.61 | -1.15 | 2,000 | 79 CIBC | 93 Toll Cross |
| 2008/10/14 12:31 | 9.63 | -1.13 | 300 | 1 Anonymous | 93 Toll Cross |
| 2008/10/14 10:27 | 10.86 | 0.1 | 500 | 93 Toll Cross | 79 CIBC |
| 2008/10/14 10:27 | 10.86 | 0.1 | 7,000 | 93 Toll Cross | 80 National Bank |
| 2008/10/14 10:27 | 10.86 | 0.1 | 1,500 | 93 Toll Cross | 79 CIBC |
| 2008/10/14 10:27 | 10.86 | 0.1 | 300 | 93 Toll Cross | 1 Anonymous |
| 2008/10/14 10:26 | 10.86 | 0.1 | 700 | 93 Toll Cross | 80 National Bank |
| 2008/10/14 10:22 | 10.89 | 0.13 | 1,500 | 93 Toll Cross | 79 CIBC |
| 2008/10/14 10:22 | 10.89 | 0.13 | 7,000 | 93 Toll Cross | 80 National Bank |
| 2008/10/14 10:22 | 10.89 | 0.13 | 1,500 | 93 Toll Cross | 79 CIBC |
| 2008/10/14 10:20 | 10.89 | 0.13 | 1,500 | 93 Toll Cross | 79 CIBC |
| 2008/10/14 10:20 | 10.89 | 0.13 | 7,000 | 93 Toll Cross | 80 National Bank |
| 2008/10/14 10:20 | 10.89 | 0.13 | 1,500 | 93 Toll Cross | 79 CIBC |
| 2008/10/14 10:18 | 10.88 | 0.12 | 1,500 | 93 Toll Cross | 79 CIBC |
| 2008/10/14 10:18 | 10.88 | 0.12 | 7,000 | 93 Toll Cross | 80 National Bank |
| 2008/10/14 10:18 | 10.87 | 0.11 | 1,500 | 93 Toll Cross | 79 CIBC |
| Here are all the trades for T: HGU on 10/ 14/2008 involving broker 11. | |||||
| Date | Price | Change | Volume | Buyer | Seller |
| 2008/10/14 10:51 | 9.92 | -0.28 | 6,600 | 11 MacQuarie | 80 National Bank |
| 2008/10/14 10:51 | 9.93 | -0.27 | 3,400 | 11 MacQuarie | 9 BMO Nesbitt |
| 2008/10/14 13:25 | 11 | 0.8 | 1,600 | 79 CIBC | 11 MacQuarie |
| 2008/10/14 13:25 | 10.99 | 0.79 | 8,400 | 7 TD Sec | 11 MacQuarie |
| Here are all the trades for T: HGU on 10/ 14/2008 involving broker 99. | |||||
| Date | Price | Change | Volume | Buyer | Seller |
| 2008/10/14 09:38 | 10.7 | 0.5 | 2,000 | 99 Jitney | 80 National Bank |
| 2008/10/14 09:40 | 10.42 | 0.22 | 1,000 | 99 Jitney | 79 CIBC |
| 2008/10/14 09:40 | 10.44 | 0.24 | 3,000 | 99 Jitney | 80 National Bank |
| 2008/10/14 09:40 | 10.46 | 0.26 | 1,000 | 99 Jitney | 80 National Bank |
| 2008/10/14 09:47 | 10.05 | -0.15 | 1,400 | 99 Jitney | 58 Qtrade |
| 2008/10/14 09:48 | 10.05 | -0.15 | 1,600 | 99 Jitney | 7 TD Sec |
| 2008/10/14 10:00 | 9.95 | -0.25 | 100 | 99 Jitney | 79 CIBC |
| 2008/10/14 10:01 | 9.95 | -0.25 | 2,900 | 99 Jitney | 7 TD Sec |
| 2008/10/14 10:42 | 9.81 | -0.39 | 3,000 | 99 Jitney | 80 National Bank |
| 2008/10/14 10:44 | 9.88 | -0.32 | 3,000 | 99 Jitney | 80 National Bank |
| 2008/10/14 10:50 | 9.91 | -0.29 | 4,000 | 99 Jitney | 9 BMO Nesbitt |
| 2008/10/14 11:01 | 10.28 | 0.08 | 1,000 | 79 CIBC | 99 Jitney |
| 2008/10/14 12:14 | 10.77 | 0.57 | 1,000 | 79 CIBC | 99 Jitney |
| 2008/10/14 12:16 | 10.77 | 0.57 | 2,000 | 79 CIBC | 99 Jitney |
| 2008/10/14 12:16 | 10.77 | 0.57 | 3,000 | 80 National Bank | 99 Jitney |
| 2008/10/14 12:27 | 11 | 0.8 | 500 | 80 National Bank | 99 Jitney |
| 2008/10/14 12:27 | 11 | 0.8 | 1,000 | 19 Desjardins | 99 Jitney |
| 2008/10/14 12:27 | 11 | 0.8 | 100 | 80 National Bank | 99 Jitney |
| 2008/10/14 12:27 | 11 | 0.8 | 400 | 80 National Bank | 99 Jitney |
| 2008/10/14 12:31 | 11.06 | 0.86 | 1,000 | 7 TD Sec | 99 Jitney |
| 2008/10/14 12:43 | 11.06 | 0.86 | 2,000 | 80 National Bank | 99 Jitney |
| 2008/10/14 12:48 | 11.12 | 0.92 | 300 | 79 CIBC | 99 Jitney |
| 2008/10/14 12:48 | 11.12 | 0.92 | 1,000 | 1 Anonymous | 99 Jitney |
| 2008/10/14 12:48 | 11.12 | 0.92 | 700 | 9 BMO Nesbitt | 99 Jitney |
| 2008/10/14 12:59 | 10.88 | 0.68 | 100 | 79 CIBC | 99 Jitney |
| 2008/10/14 12:59 | 10.88 | 0.68 | 100 | 79 CIBC | 99 Jitney |
| 2008/10/14 12:59 | 10.88 | 0.68 | 200 | 79 CIBC | 99 Jitney |
| 2008/10/14 12:59 | 10.88 | 0.68 | 200 | 79 CIBC | 99 Jitney |
| 2008/10/14 12:59 | 10.88 | 0.68 | 100 | 79 CIBC | 99 Jitney |
| 2008/10/14 12:59 | 10.88 | 0.68 | 100 | 79 CIBC | 99 Jitney |
| 2008/10/14 12:59 | 10.88 | 0.68 | 2,200 | 80 National Bank | 99 Jitney |
| 2008/10/14 13:09 | 10.98 | 0.78 | 600 | 7 TD Sec | 99 Jitney |
| 2008/10/14 13:09 | 10.95 | 0.75 | 1,700 | 79 CIBC | 99 Jitney |
| 2008/10/14 13:09 | 10.95 | 0.75 | 200 | 80 National Bank | 99 Jitney |
| 2008/10/14 13:13 | 10.95 | 0.75 | 2,500 | 80 National Bank | 99 Jitney |
| 2008/10/14 13:14 | 10.98 | 0.78 | 1,000 | 80 National Bank | 99 Jitney |
| 2008/10/14 14:55 | 10.1 | -0.1 | 2,000 | 99 Jitney | 80 National Bank |
| 2008/10/14 15:01 | 10.25 | 0.05 | 2,000 | 99 Jitney | 9 BMO Nesbitt |
| 2008/10/14 15:05 | 10.36 | 0.16 | 600 | 79 CIBC | 99 Jitney |
| 2008/10/14 15:05 | 10.36 | 0.16 | 200 | 79 CIBC | 99 Jitney |
| 2008/10/14 15:05 | 10.36 | 0.16 | 500 | 88 E-TRADE | 99 Jitney |
| 2008/10/14 15:06 | 10.36 | 0.16 | 700 | 7 TD Sec | 99 Jitney |
| 2008/10/14 15:07 | 10.33 | 0.13 | 500 | 79 CIBC | 99 Jitney |
| 2008/10/14 15:07 | 10.33 | 0.13 | 100 | 79 CIBC | 99 Jitney |
| 2008/10/14 15:07 | 10.33 | 0.13 | 100 | 79 CIBC | 99 Jitney |
| 2008/10/14 15:07 | 10.33 | 0.13 | 600 | 79 CIBC | 99 Jitney |
| 2008/10/14 15:07 | 10.33 | 0.13 | 200 | 79 CIBC | 99 Jitney |
| 2008/10/14 15:07 | 10.33 | 0.13 | 300 | 79 CIBC | 99 Jitney |
| 2008/10/14 15:07 | 10.33 | 0.13 | 200 | 79 CIBC | 99 Jitney |
| 2008/10/14 15:17 | 10.3 | 0.1 | 2,000 | 99 Jitney | 46 Blackmont |
| 2008/10/14 15:21 | 10.47 | 0.27 | 1,200 | 1 Anonymous | 99 Jitney |
| 2008/10/14 15:21 | 10.47 | 0.27 | 800 | 7 TD Sec | 99 Jitney |


